
I had planned to begin these installments next weekend, on January 11, but I think it is necessary to move them up. Taking advantage—on this one occasion only—both the Context Analysis and the Economic Analysis will be freely accessible this weekend. Free followers will thus be able to assess whether subscribing to these two weekly analyses is of interest to them.
The latest economic activity data, for the month of October, turned out to be much more positive than anyone expected, including INEGI’s own “timely” indicator, published the day before (which confirms that this timely indicator is useless). According to that indicator, economic activity would have grown by 0.5% in October, and the next day we learned that it had actually grown by 1.7%—more than triple.
The unusual nature of the data is clearer in figure 1. It shows the General Index of Economic Activity (IGAE) in its seasonally adjusted version, and you can confirm that we have not seen a jump of that size in quite some time.
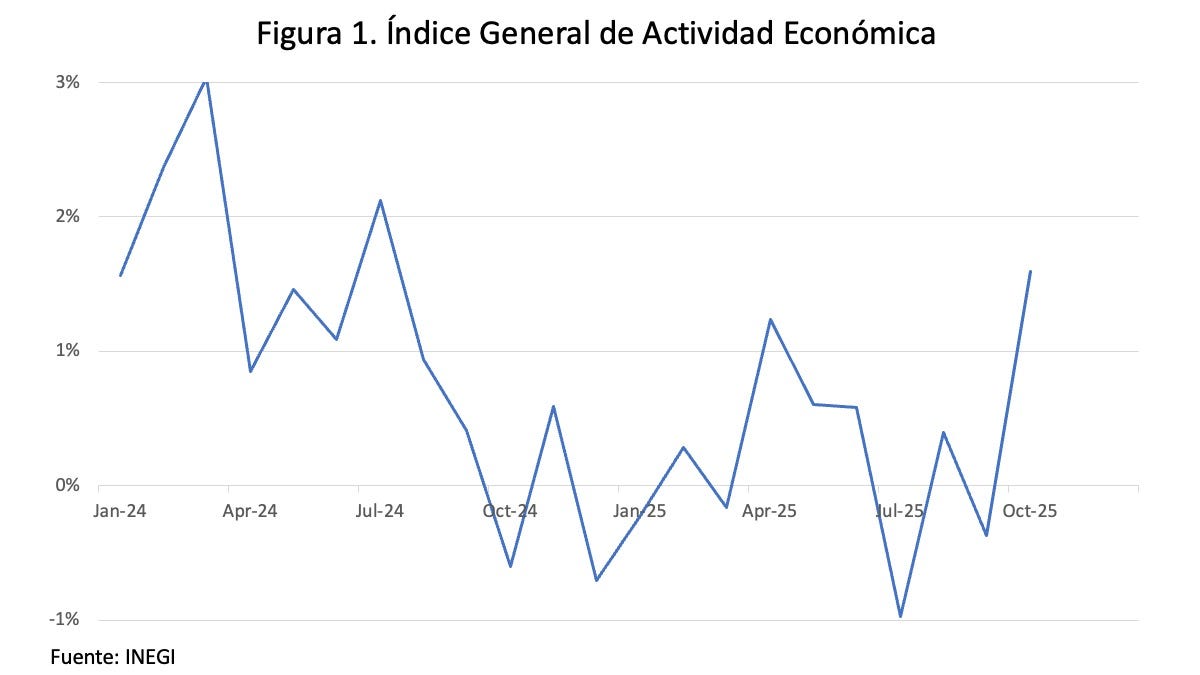
As is often the case, I have my doubts about the figure—not because I doubt INEGI, but because it may be yet another case of a single swallow that does not make a summer. We had an end of the year with strange behavior in several indicators, which suggests a very negative figure for November.
I show you a couple of these indicators in figure 2: VAT collection and total imports. It is no coincidence that I use these two—remember that most VAT is collected at customs.
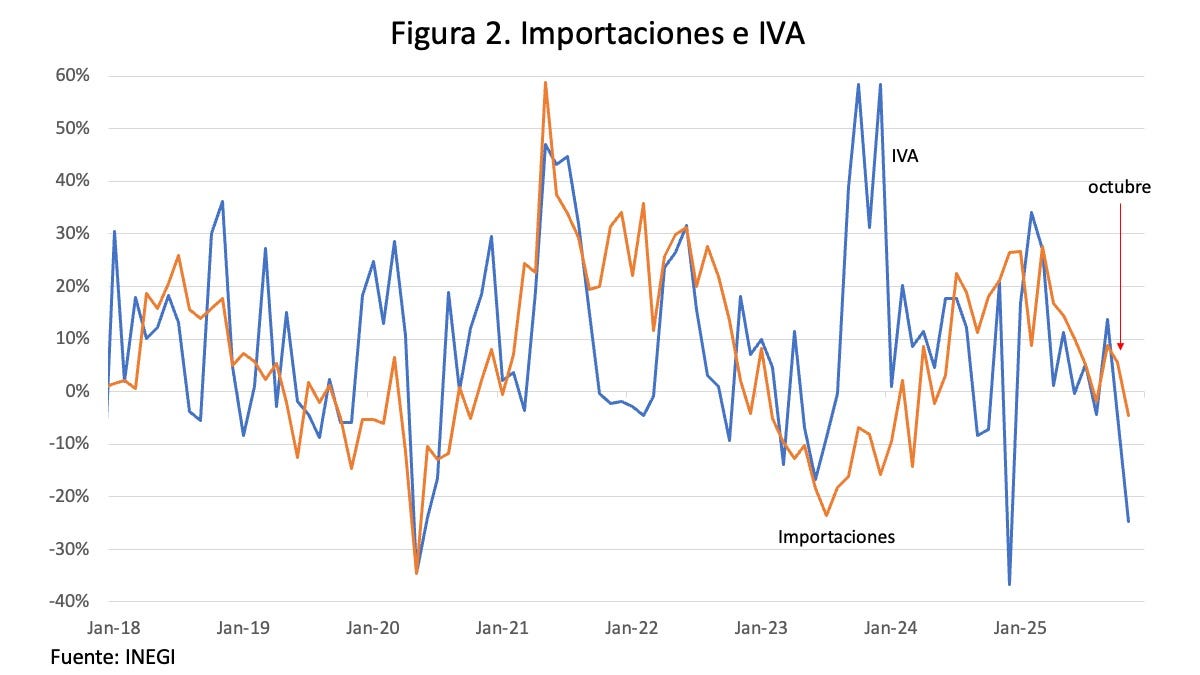
The blue line is VAT collection and the orange line is total imports, both measured in pesos. In both cases, what I show is year-on-year growth. I placed my traditional little red arrow to indicate the month of October. Both indicators have already been published for November, and they show a decline—very sharp in the case of VAT. Although the import data are preliminary, and the revenue data do not cover the entire month of November (part of the taxes are collected days or weeks after the transactions), the behavior is worrisome.
As you know, during those days the Chamber of Deputies was already debating the imposition of tariffs on many products, and it is very likely that between September and October we saw extraordinary purchases to build up inventories ahead of the tariffs. You surely remember that the same thing happened in the United States after Trump’s victory in November 2024: from then until “Liberation Day,” U.S. firms overbought.
Taking that possible behavior into account, figure 3 shows what I believe could happen with the IGAE in November and December.
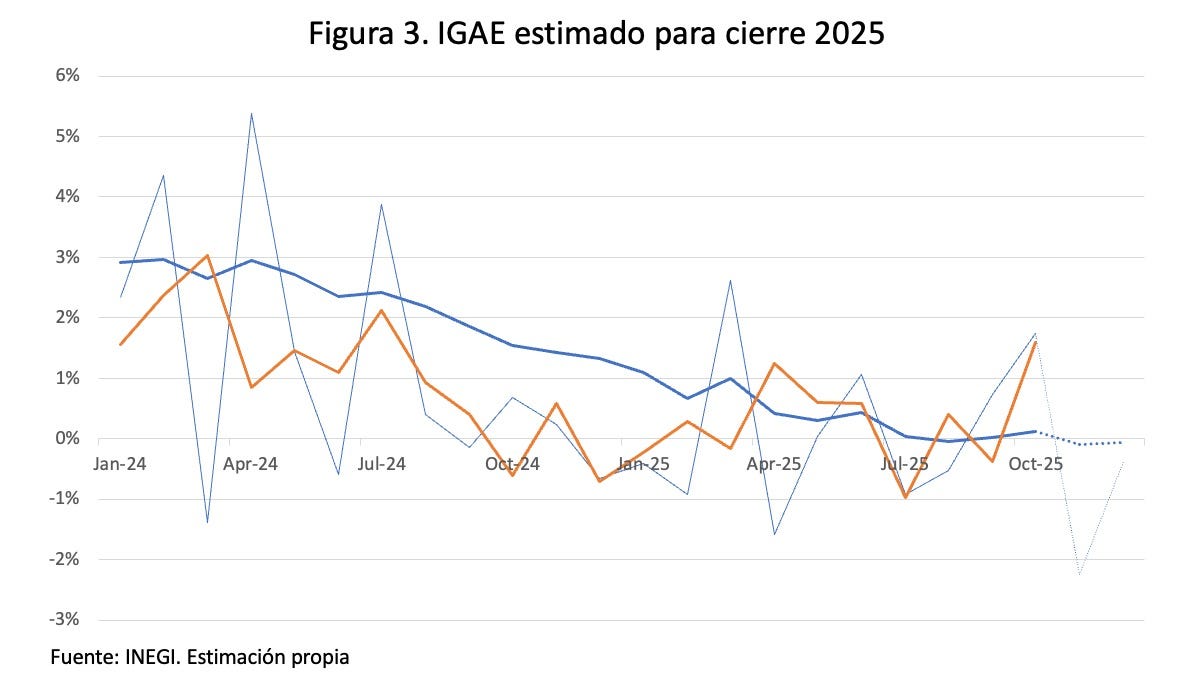
The orange line is the same series we saw in figure 1, the seasonally adjusted IGAE. The thin blue line is the original IGAE (which clearly moved in a strange direction), and the thick blue line is the annual cumulative figure. The dotted portion is my estimate for November and December, which would leave us with growth of practically zero for 2025. At the end of the month, the timely GDP figure will be published, and we shall see.
In more detail, I had already mentioned that retail trade showed behavior that did not seem logical to me. I now review it in detail. Figure 4 shows the components of retail sales, each with its contribution to sector growth.
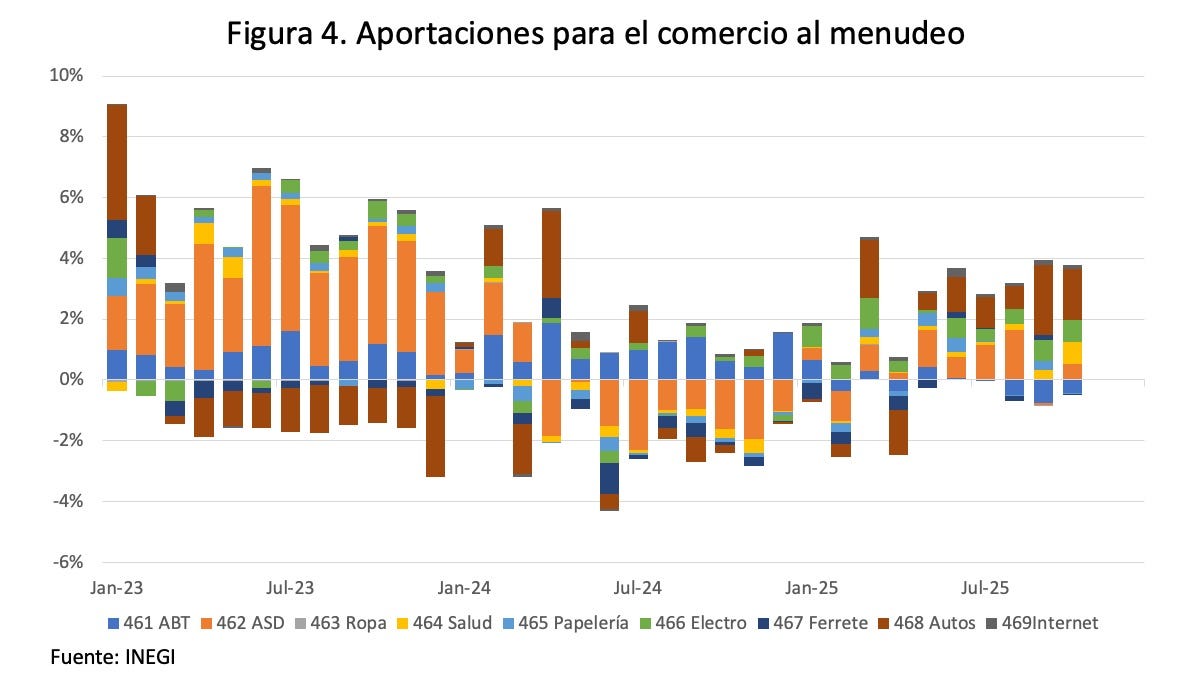
The dark blue bar is groceries (food, beverages, and tobacco, ABT), and the orange bar is supermarkets and department stores. The others are more or less self-explanatory, although 466 is household appliances and 468 is transportation expenses, not just automobiles. Note that during 2025 most of the growth comes precisely from these transportation expenses, and to a lesser extent from appliances and department stores.
For the latter two, we had suggested that they were related to the cheaper dollar during the year, and I think that is correct. Transportation, however, is something odd, as we will see later. Before that, figure 5 shows the year-on-year growth of the components (not all of them, because the figure would be even more confusing).
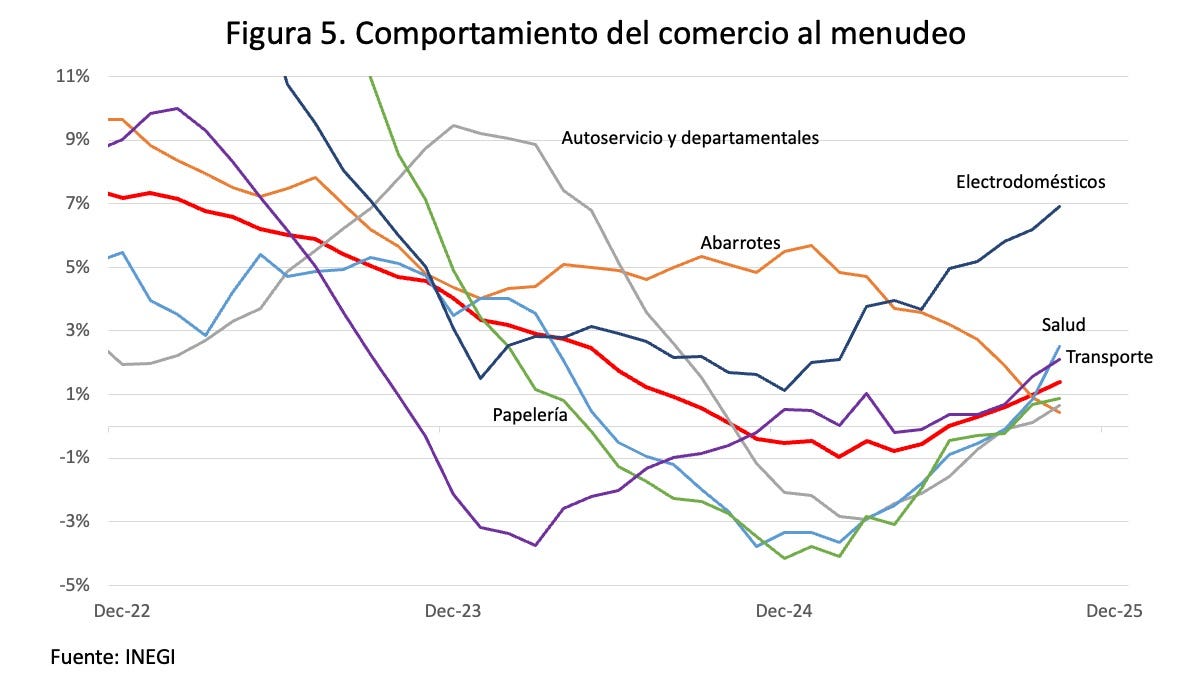
The accelerated growth in household appliances is very evident, as are health-related expenditures—yet another sign of the terrible destruction of Mexico’s public health system. Transportation comes in third.
But in 2025 not many cars were sold, so I wanted to look inside this component, which I show in figure 6. Component 468, Transportation, has four subcomponents: automobiles, auto parts, motorcycles, and fuels and oils.
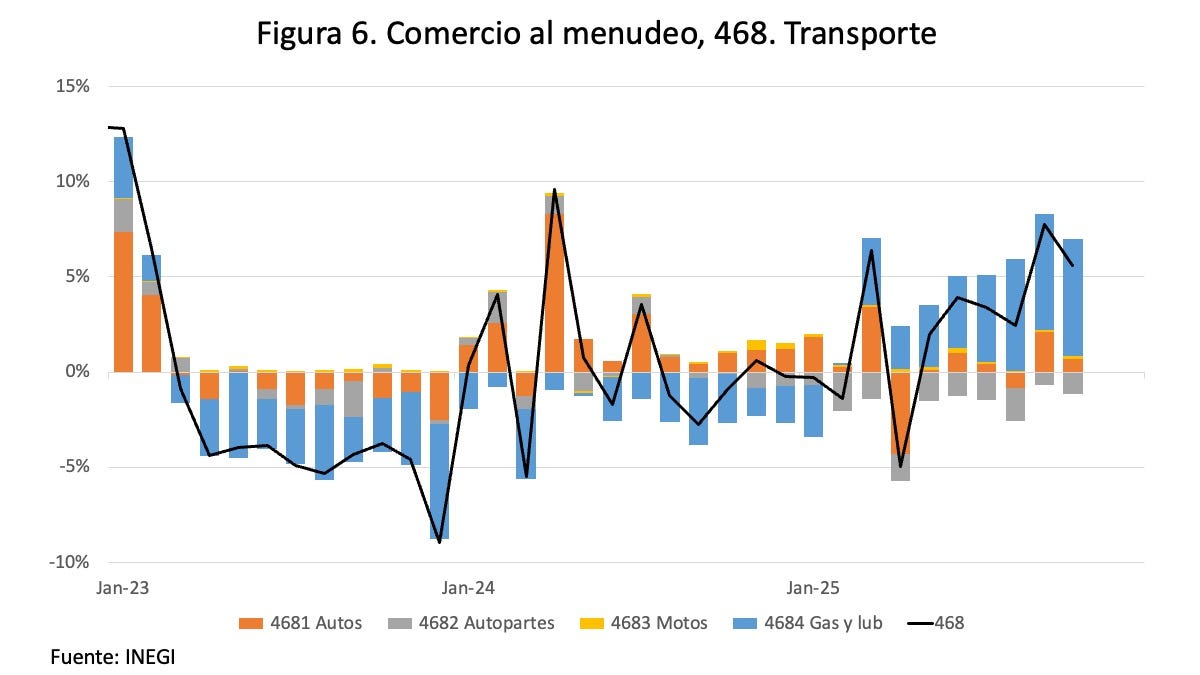
In the previous two years, people spent less on fuels and oils, and surprisingly, in 2025 that spending increased—and by a lot. Curiously, auto parts had a bad year, although automobile sales more or less held up.
One would assume that if more is being spent on fuels and oils, it is because there is more movement on the roads, and we can approximate that with the behavior of the transportation sector as it appears in the IGAE. Well, that is what we see in figure 7. The orange line is transportation growth, while the blue line is growth in fuel and oil sales.
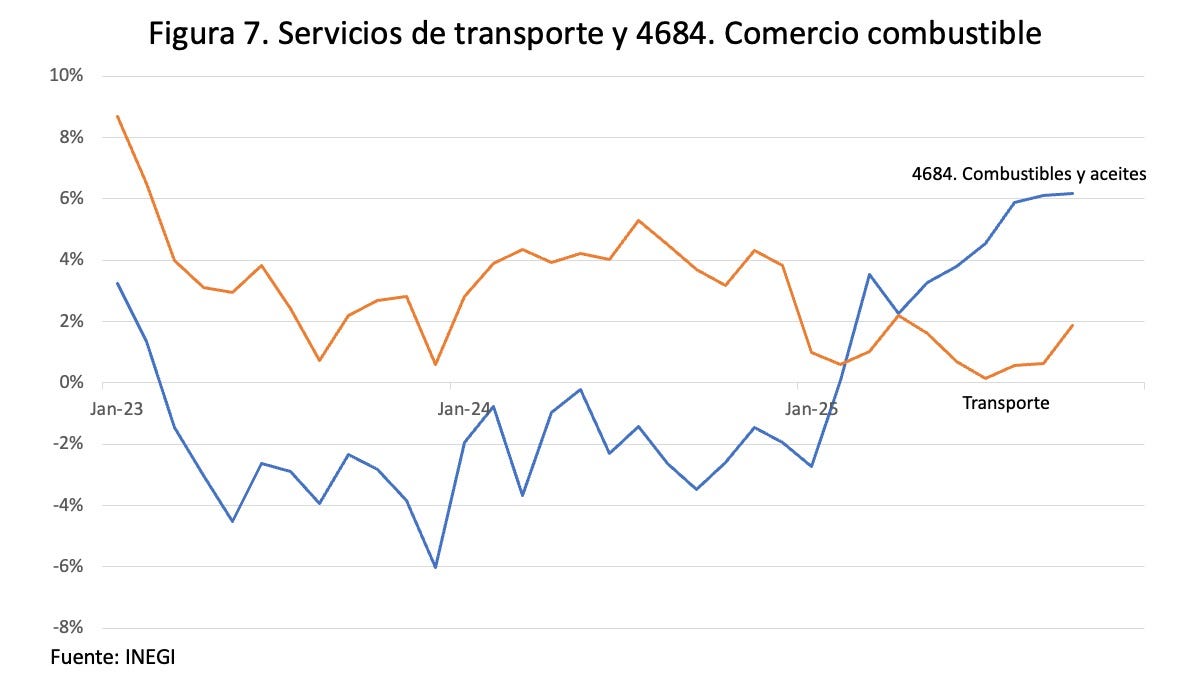
From late 2024 onward, while transportation grows between 0% and 2%, fuel sales move from negative territory to growth rates of up to 6%. While we figure out more precisely what is going on, I suspect that in the previous two years more gasoline was being sold but not recorded: fuel smuggling that the media call “fiscal huachicol.”
If that is the case, it is good news: part of the fuel market has returned to the formal sector. In terms of growth, however, it is not so good, because it means that there is not really growth—only that something previously sold illegally is now being recorded. At bottom, it is yet another example of the difficulties of measurement in a country so little inclined toward the rule of law. In upcoming installments, I will return to the problems involved in measuring employment, which will help us gain a better understanding of the economy’s behavior.